
Research Methods
A variety of lab-based methods are available to help explore the relationship between form and function in living animals (including humans). Since our research focus is on locomotion, we use different types of recording equipment to document limb motion (displacement, velocity, acceleration) during natural behaviors, the activity profiles of muscles that bring about that motion, as well as the forces that the limbs and muscles generate as the subject moves over a substrate. The approaches we use are minimally to non-invasive and the methodologies are the same whether we are working with animal or human subjects. The empirical data generated from our lab-based research are integrated with detailed models of the musculoskeletal system to generate simulations of locomotion that help test specific questions about form-function relations and the origins of habitual locomotor patterns, such as hominin bipedalism.
Kinematics and Kinetics
Kinematics refers to a description of the motion of rigid bodies, and kinetics concerns the study of the forces that act on those rigid bodies in association with that motion (Biewener & Full, 1992). Though each can be conducted separately, the combination of the two offers a powerful non-invasive approach to the study the biomechanics of animal locomotion. Collection of kinematic data involves camera recordings of the animal subject while in motion through a calibrated space using a pre-determined coordinate system. The type of kinetic data that are collected in conjunction with kinematics consists of ground reaction forces recorded using force platforms.
The Primate Locomotion Laboratory has a dedicated room for kinematic and kinetic recordings that is equipped with a high speed motion capture system (ProCapture, Xcitex Inc., Woburn, MA and four BP400600 force plates (AMTI, Watertown, MA). This video-based motion capture system was selected because it could be customized for our application and (a) allows continuous recordings of experimental sessions up to 40 minutes and selective permanent storage of events of interest; (b) permits analogue data display and storage in sync with videos; (c) offers powerful auto-digitizing tools suited for flat markers in combination with manual digitizing options of video images.
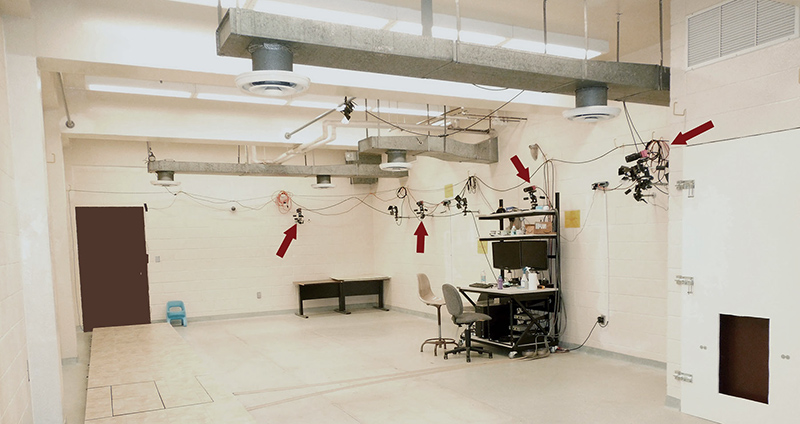
Stony Brook Primate Locomotion Lab, kinematics/kinetics recording room. Photograph by Brigitte Demes, nd
The cameras are wall-mounted along one side of the room while the animals are moving on a runway or on simulated arboreal supports on the other side of the room. The animals are habituated to being in the room while the researchers are monitoring the recording equipment, and are under the constant supervision of an animal trainer. For overground locomotion, motion and force data are captured simultaneously and synchronized in ProCapture (Xcitex Inc., Woburn MA). Typically, video data are captured at 150Hz, whereas force data are captured at 1500Hz. Simulated arboreal substrates (vertical climbing pole, horizontal branch-like supports) are not instrumented, but horizontal branches can be mounted on the force plates and substrate reaction forces obtained in this way.
Calibration fixtures of various dimensions are used to calibrate spaces that allow capture of whole body motion or focus on specific parts of the body. The cameras are equipped with zoom lenses and can be directed and focused on spaces of various dimensions. Cameras can also be used on tripods and positioned in different spatial configurations.
Prior to recording sessions, markers are painted on the animal subject’s skin using non-toxic paint. Body segments are represented by triads of markers, and additional markers are applied to the skin over bony landmarks associated with joints. Digital video is recorded continuously into a buffer, and video segments of typically four seconds in length are stored permanently as avi files.
Chimpanzee subject with digitized markers in one camera view. Export from Xcitex ProAnalyst Program, 9/26/2013.
For analysis, the digital video files are brought into ProAnalyst software (Xcitex Inc., Wolburn, MA) and markers are digitized in all camera views. The software then applies a direct linear transformation algorithm to calculate 3D coordinates for markers in the field of view of pairs of cameras, using information on the spatial configuration of the cameras gained in the calibration process. In a final step, the coordinate data calculated for all pairs of cameras are merged and exported into Excel or in txt format. The 3D force data are also exported (au2 format which can be imported into excel or a text editor), and kinematic and kinetic data files have the same time line column to keep them synchronous.
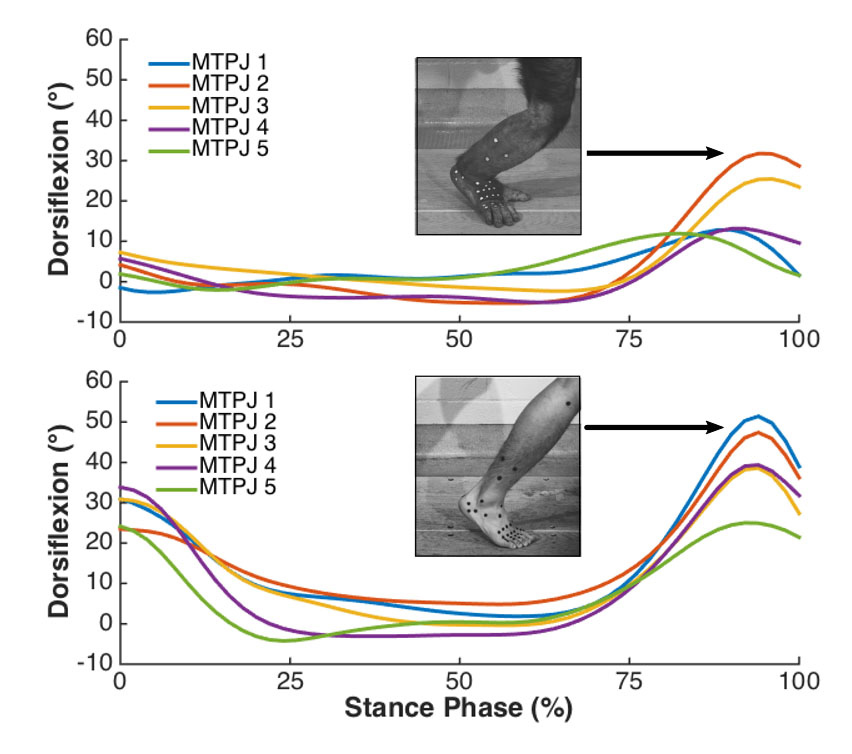
Examples of metatarsophalangeal joint motion during stance phase of steps from chimpanzee and human subjects (Holowka, 2015)
Coordinate data files are imported into MatLab (MathWorks Inc., Natick, MA) for calculating linear and angular kinematics in custom-written algorithms or the KineMat software package (Reinschmidt and van den Bogert, 1997). Marker triad coordinates in a neutral joint position are used to define local coordinate systems for segments and aligned with the global coordinate system. 3D joint angles are determined as a series of Cardan angle rotations of adjacent segment coordinate systems that describe the position of one segment’s coordinate system relative to that of the other. Instantaneous joint angles for multiple strides are normalized on the time axis and means and standard deviations calculated for each time point.
Electromyography
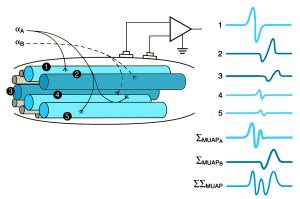
Motor neurons (αA, αB) initiate action potentials in the muscle cells in their motor units (1,4,5 and 2,3, respectively) that are registered by a nearby electrode. The strength of the recorded signal is related in part to the distance of the cell from the electrode. The motor unit action potential is the sum of action potentials of the individual cells (ΣMUAP), and the sum of all the activated motor units (ΣΣMUAP) is the recorded EMG signal. Figure adapted from Kamen, 2004
Muscle force is the tension produced by the shortening of individual muscle fibers (cells) when they are activated. Activation refers to a process whereby a signal from the central nervous system travels through motor neurons and initiates a series of cellular events causing waves of temporary depolarization of the muscle cell membrane, something known as an action potential. A single motor neuron can innervate a few or many muscles cells, and all of the cells it innervates (a motor unit) become activated simultaneously. A sensor (electrode) placed in the vicinity of these motor units detects the changes in electrical potential caused by the action potentials, and relays this information to a recording device. This technique of monitoring muscle activation is known as electromyography or EMG.
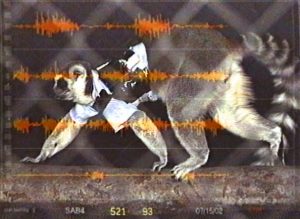
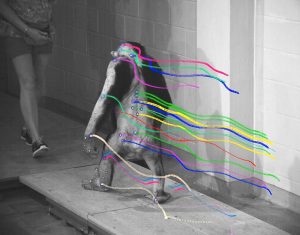
Screen capture of an EMG recording showing superimposition of EMG traces onto video recording of the research subject. Illustration by Susan Larson, nd
At the Stony Brook Primate Locomotion Lab, we use insulated bipolar fine-wire electrodes to record muscle activity patterns. Fine wire electrodes pick up a signal over a smaller area than surface electrodes and therefore permit greater specificity in recording from individual muscles, as well as from more deeply placed muscles. In addition, non-human primate subjects typically do not tolerate having objects stuck to their skin and easily peal surface electrodes off. The wire electrodes are connected to a four-channel FM telemetry transmitter package (~ 112 g; Bio-Sentry Telemetry) that is affixed to the back of the animal subject by a nonrestrictive harness. The transmitted EMG signals are detected by an FM receiver and sent to an A-D converter. The digital signal (using a sampling frequency of 2880/sec) plus a simultaneous video image of the subject is recorded on a PC using the ProCapture software package (Xcitex, Inc.) and later analyzed using ProAnalyst (Xcitex, Inc.) to collect samples of step cycles.
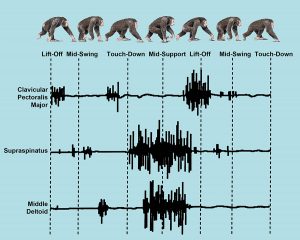
Example of EMG traces. Illustration adapted from Larson and Stern, 1987, Fig. 9
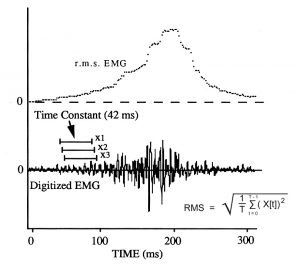
Root mean square method of EMG quantification. Illustration adapted from Hylander and Johnson, 1993, Fig. 3
The signal that is detected by the FM receiver is known as raw EMG, and can be visualized as a series of deflections (EMG spikes) from a baseline when plotted relative to time. The baseline corresponds to periods of muscle inactivity, and the size and number EMG spikes reflects the intensity of muscle activation. The EMG is quantified as a running root mean square, using a time constant of 42.01 msec (121 samples) and calculating the result at intervals of 1.04 msec (3 samples).
To characterize the pattern of recruitment of a muscle during locomotion, samples of step cycles are collected and quantified, and the quantified EMG for the sample is summarized as a quartile distribution.
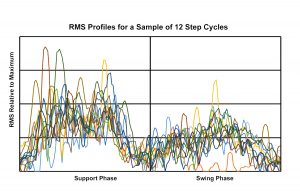
Plot of individual EMG root mean square curves for a sample of 12 step cycles. Each curve has been equalized in regard to phase length, and scaled to the maximum burst observed during the recording session. Illustration by Susan Larson, nd
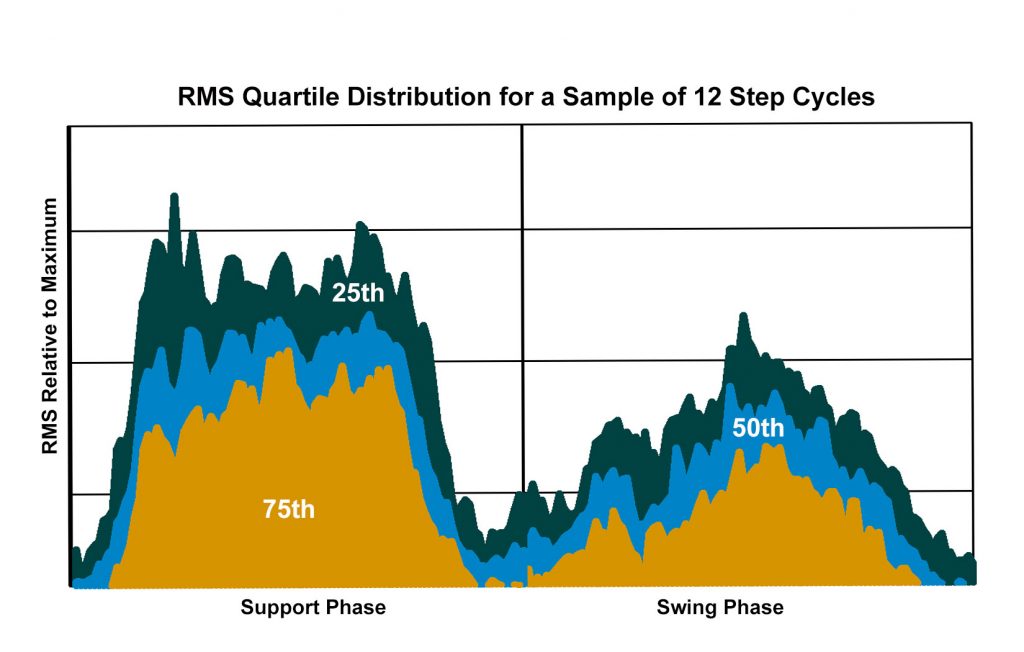
Plot of the quartile distribution of the EMG activity derived from the root mean square curves for a sample of 12 step cycles. The 75th quartile is interpreted as consistent EMG activity; the 50th quartile reflects frequent but less consistent activity; 25th quartile represents occasional activity. Illustration by Susan Larson, nd
To create a representative activity profile for each muscle, plots of the 75th plus 50th quartiles of EMG activity during a sample of steps (scaled to the maximum burst observed during the recording session) for different recordings from the same individual, and for recording from the two individuals, are made semitransparent and superimposed. The darkest areas reflect the most consistent timing and amplitude of muscle activation, and the increasingly lighter shaded regions correspond to less frequent and more variable EMG activity.
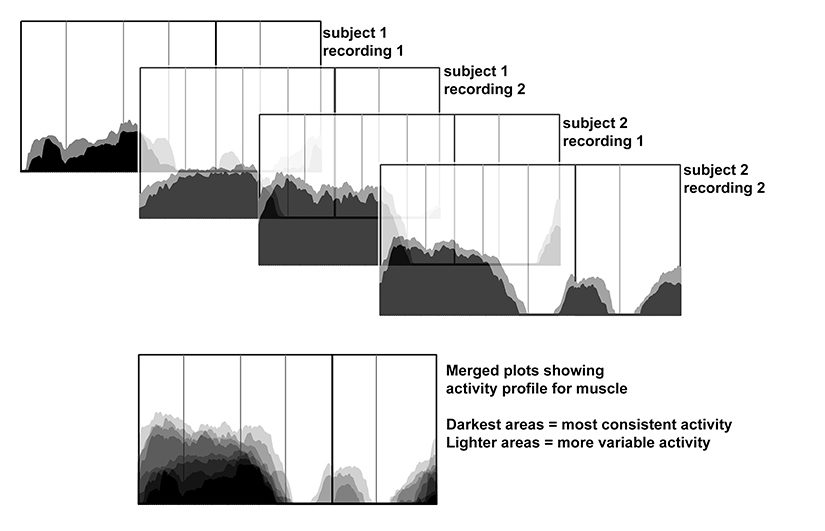
To create an overall activity profile for a particular muscles that is based on multiple recordings, the individual plots of the quartile distributions from each recording are rendered semitransparent graphically, then superimposed. Illustration by Susan Larson, nd
Modeling
Computer models of the musculoskeletal system can provide unique insights as to how the many bones, joints and muscles work in an integrated fashion. Computer models can be used to better understand how the musculoskeletal system responds both to the control signals from the central nervous system and to the forces imparted on the body by the environment. A musculoskeletal model is created by scanning the bones from a skeleton of the intended animal model, and then reconstructing the joints, muscle attachments, and muscle pathways in specialized computer software. Muscle properties, such as size, strength and leverage, are assigned based on data obtained from dissections of deceased animals. The completed model can then be used to generate computer simulations of different movement patterns, such as walking. Musculoskeletal models can be validated both statically, by comparing model predictions with data obtained from dissections, and dynamically, by comparing simulation results to kinematic, kinetics and EMG data from experimental subjects.
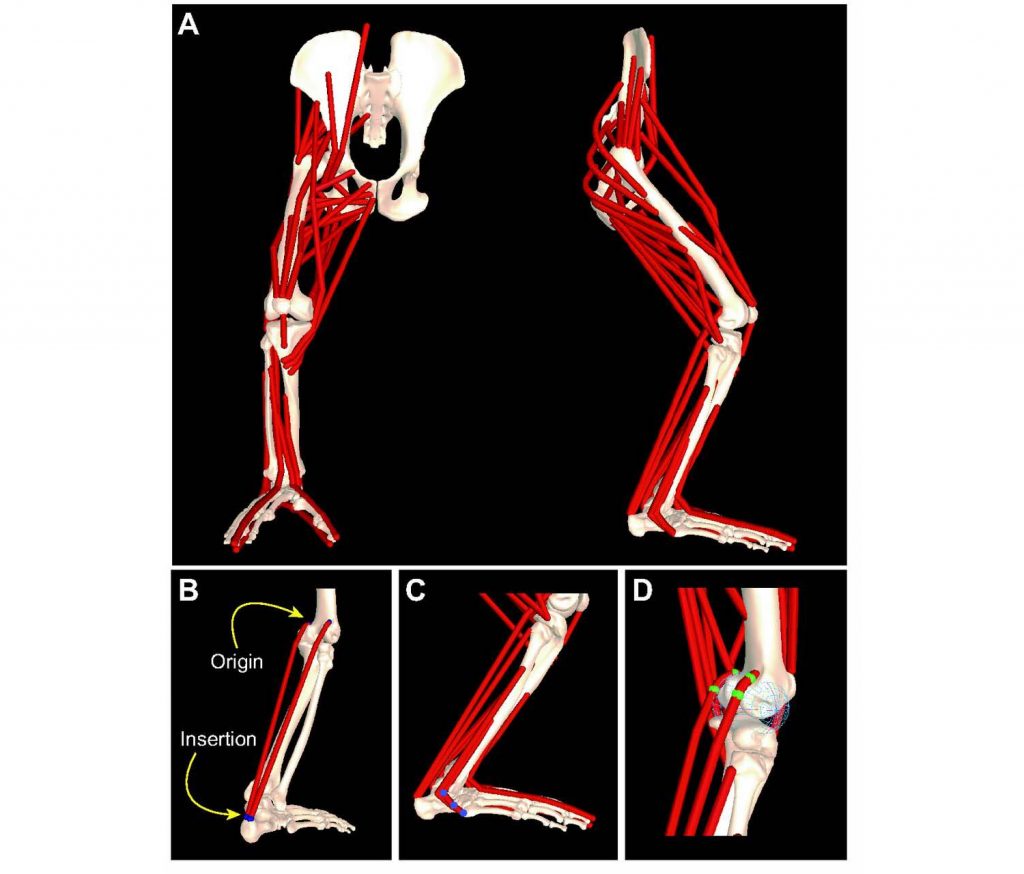
Three-dimensional musculoskeletal model of the chimpanzee pelvis and hind limb. From O’Neill et al., 2013, Fig. 1. An OpenSim version of the chimpanzee pelvis and hind limb model may be downloaded here: https://simtk.org/projects/chimphindlimb